Kīlauea is a shield volcano on Hawaiʻi Island. Its activity has shifted between the summit and rift zones, so “Kīlauea is active” can describe different places, processes, and hazards at different times. This selected timeline gives context for those changes; it is not a live status report.
AN INTERACTIVE FIELD NOTE · MAY–SEPTEMBER 2018
Two parts of Kīlauea changed at once
Choose a date. The summit and rift tracks stay together, revealing how one eruption reshaped two distant parts of the volcano.
SCHEMATIC · NOT TO SCALEHISTORICAL · 2018
LOWER EAST RIFT ZONEFirst breakout May 3 · last visible lava Sep 5
SUMMIT / CALDERAExplosive activity May 16; episodic collapses late May–Aug 2
Lava reaches Kapoho Bay
A channelized flow from Fissure 8 entered the ocean at Kapoho Bay while episodic summit collapse events continued.
Timeline bands show the documented event intervals; activity was not constant throughout. The summit and rift events overlap. The scene is explanatory, not a reconstruction of the magma pathway.
THE 2018 ERUPTION, ON THE GROUND
A rift-zone eruption reshaped the coast
In 2018, lava traveled from lower East Rift Zone fissures toward the coast. The map shows the mapped flow footprint; the photograph shows what that change looked like in Leilani Estates.
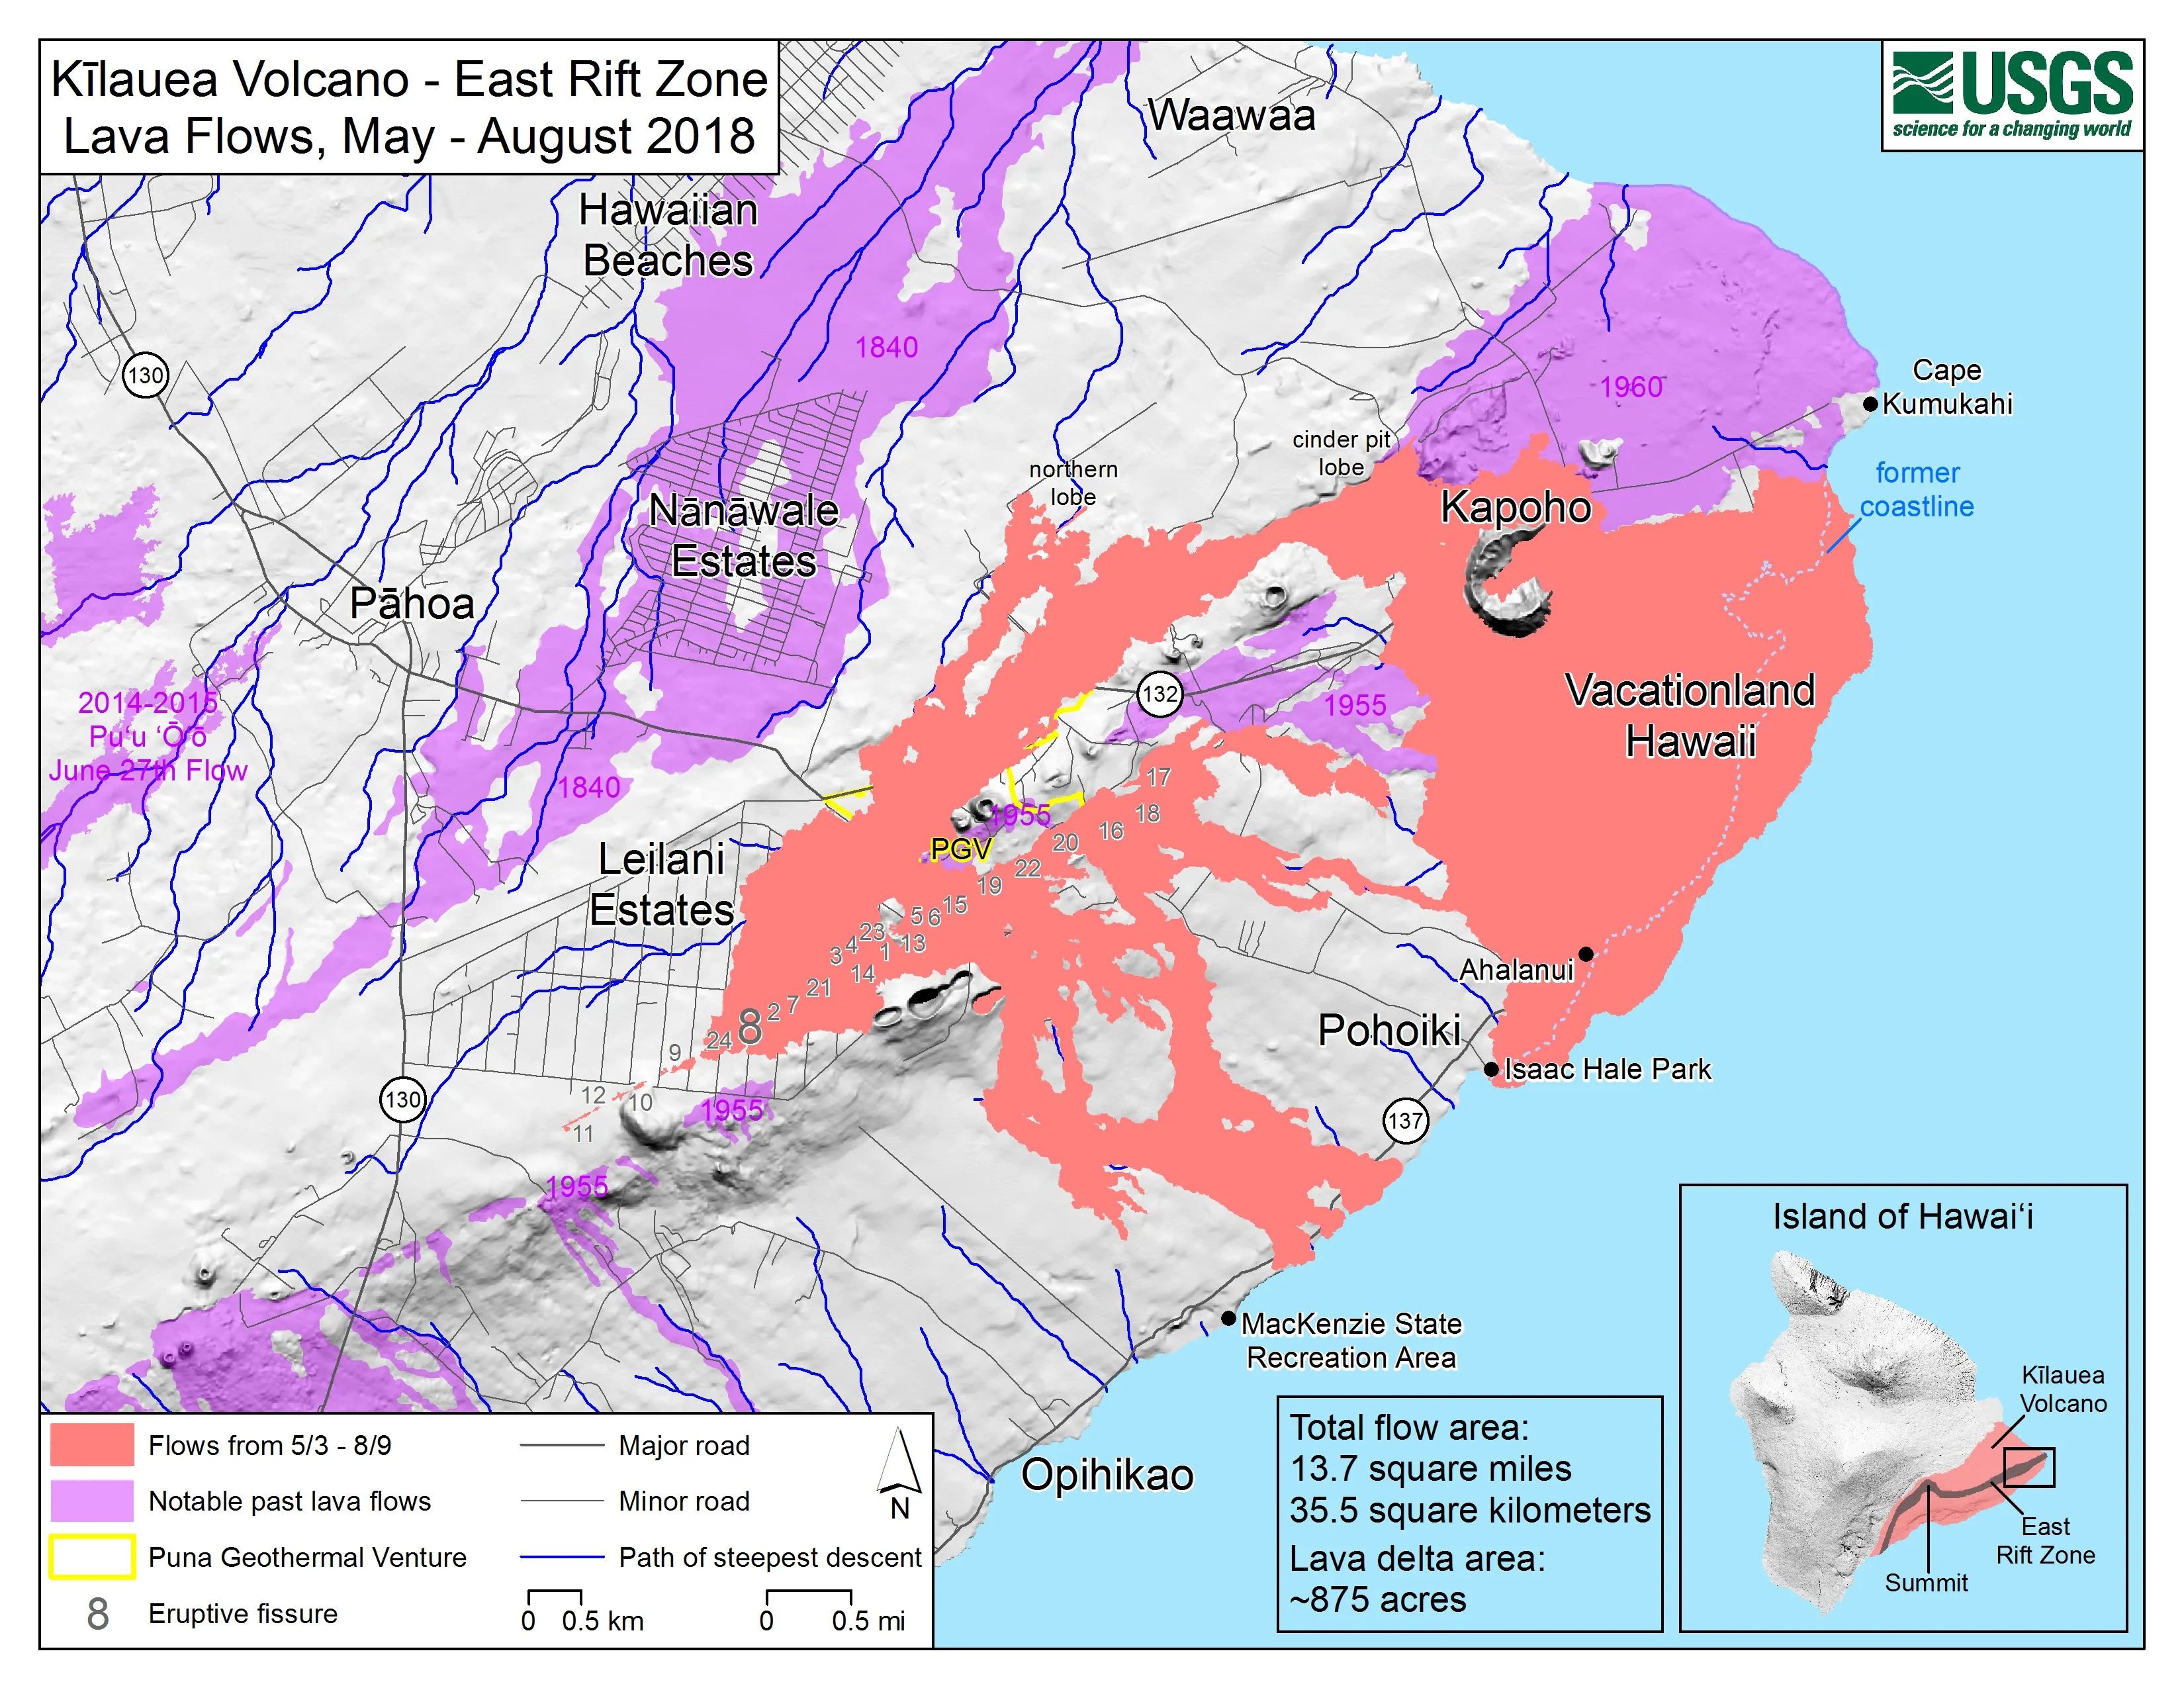
The USGS-mapped flows covered about 35.5 square kilometers and added roughly 875 acres of new land to East Hawaiʻi.
Map: USGS Hawaiian Volcano Observatory · Public domain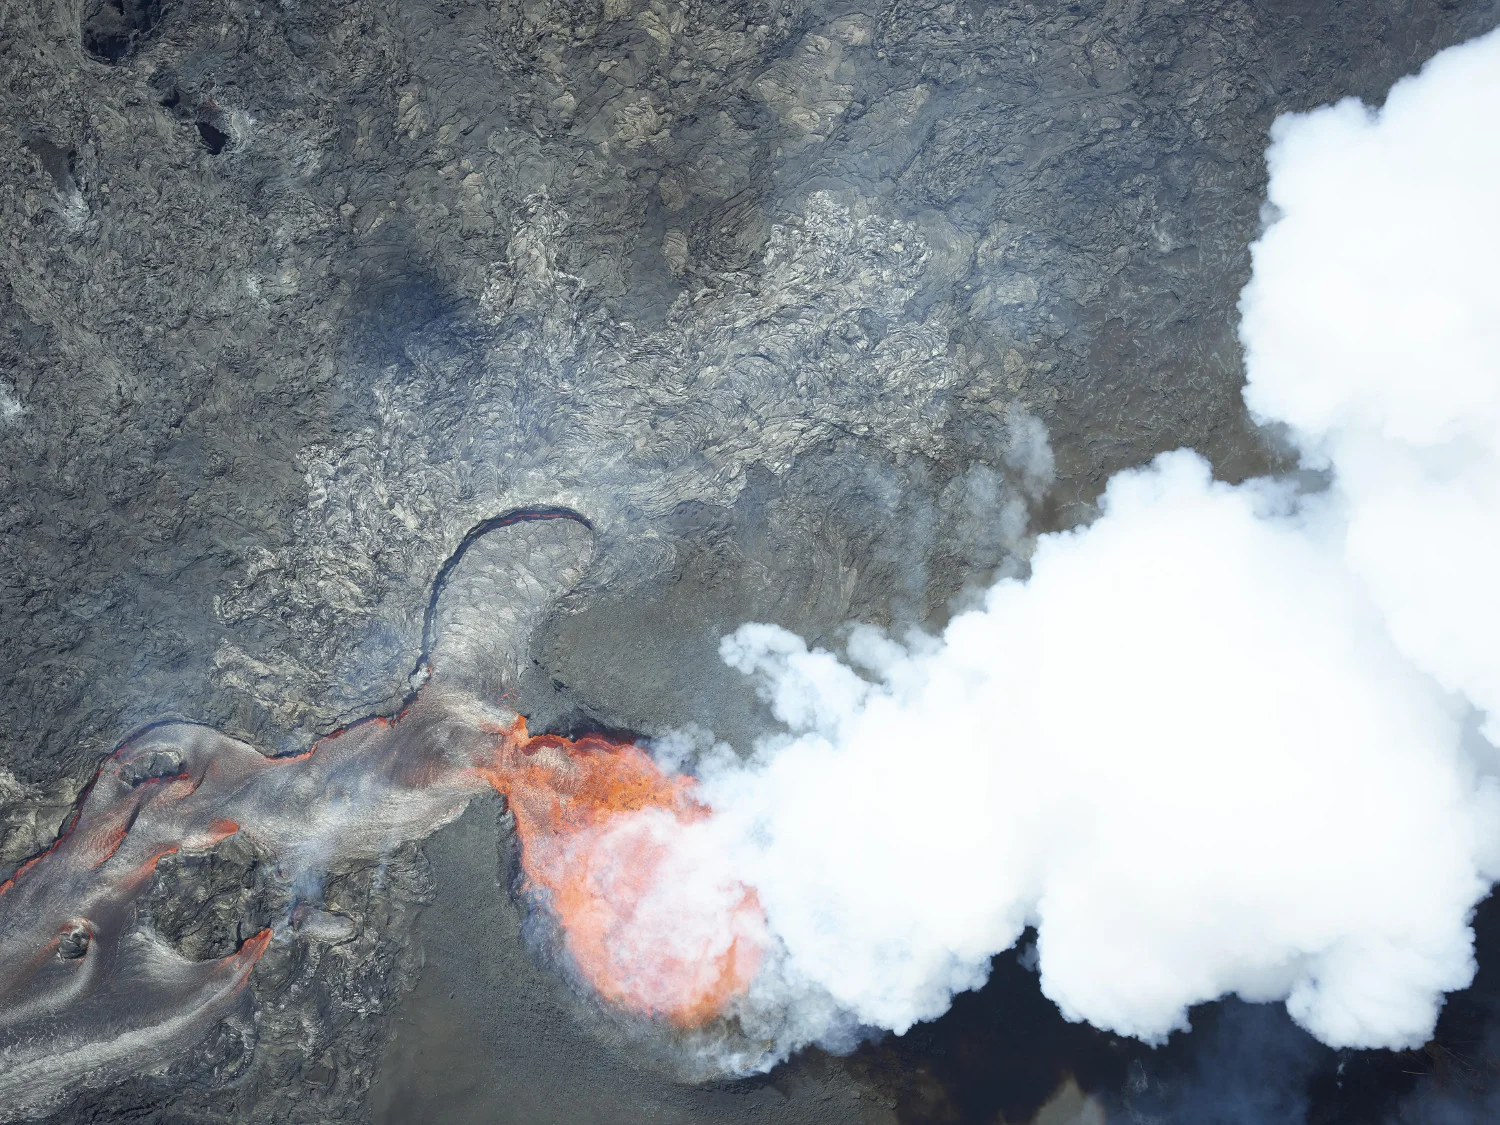
Lava moves through a residential area. The image was collected during a USGS 3D elevation-mapping mission.
Photo: USGS EROS Center · Public domainA long-running East Rift Zone eruption
The Puʻu ʻŌʻō eruption began on January 3, 1983. Activity along Kīlauea’s East Rift Zone continued for decades, with changes in vents and lava-flow paths over time.
Lower East Rift Zone eruption and summit collapse
New fissures opened in the lower East Rift Zone while the summit caldera subsided and collapsed in stages. The eruption affected communities and infrastructure; the rift-zone activity and summit changes were connected parts of the same major episode.
Water appeared in Halemaʻumaʻu
A water lake formed at the base of Halemaʻumaʻu after the 2018 collapse. The water level rose until a summit eruption began on December 20, 2020, quickly vaporizing the lake.
Repeated summit eruptions and pauses
The December 2020 eruption began a series of summit eruptions within Halemaʻumaʻu, separated by pauses. USGS publishes a dated episode timeline; consult it for the latest reviewed chronology because the sequence continues to change.
What this history helps explain
- Location matters: summit activity and rift-zone activity can create different conditions and hazards.
- Pauses are part of the record: a pause in eruptive activity is not the same as a statement that all unrest has ended.
- Past patterns are context, not a forecast: previous timelines do not determine when or where the next change will occur.
For current conditions, use the latest Hawaiian Volcano Observatory notice and its hazard analysis. MagmaAlert’s Kīlauea dashboard helps locate selected public information; the USGS remains the source for official status and scientific interpretation.
Primary sources
- USGS Kīlauea overview and current information
- USGS 2018 lower East Rift Zone eruption and summit collapse
- USGS map of the 2018 lower East Rift Zone lava flow (public domain)
- USGS photograph of lava flowing through Leilani Estates (public domain)
- USGS questions and answers about Kīlauea summit water
- USGS Kīlauea eruption episode timeline
Written by the MagmaAlert team from the linked USGS sources. This is a selected historical summary, not an exhaustive chronology or a current hazard assessment. Send a correction if you find an error.