When Mauna Loa woke up
38 years since its last eruption. Two weeks of lava. A close look at what monitoring revealed, and what it could not.
A road crossed. A highway spared.
The flow cut the Mauna Loa Observatory access road in its first day. It later stopped short of Saddle Road, the major route across Hawaiʻi Island.
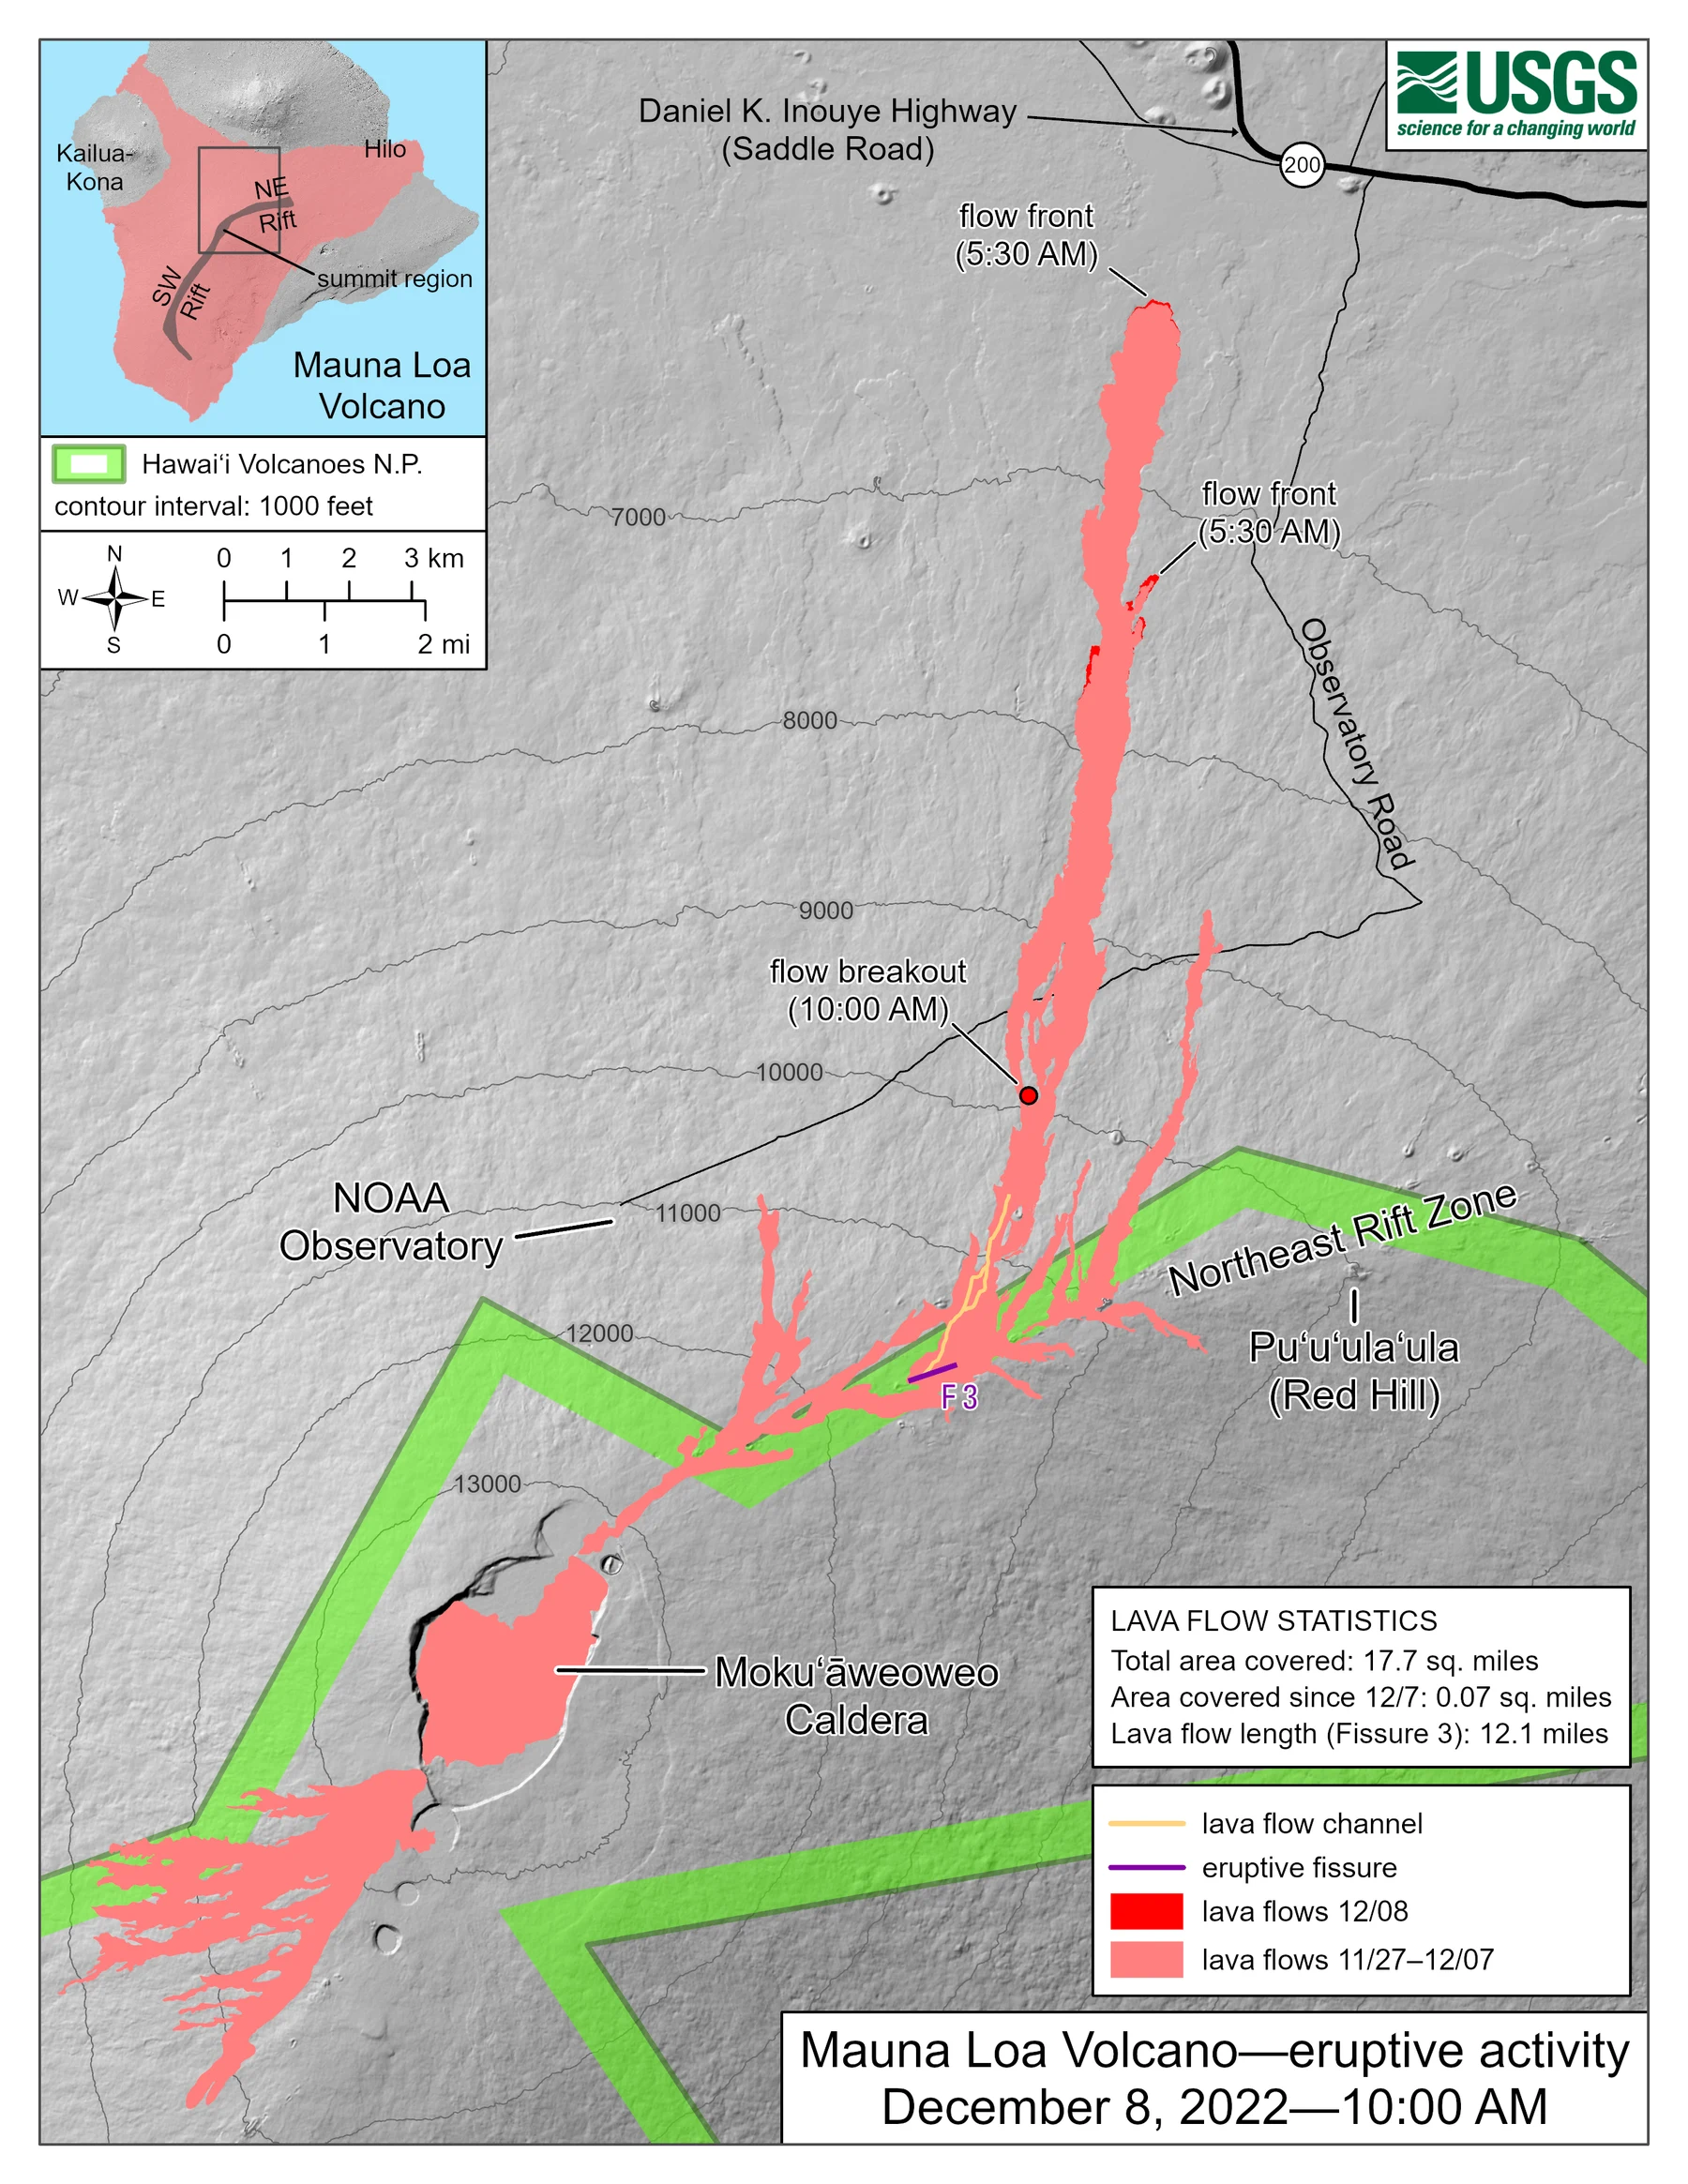
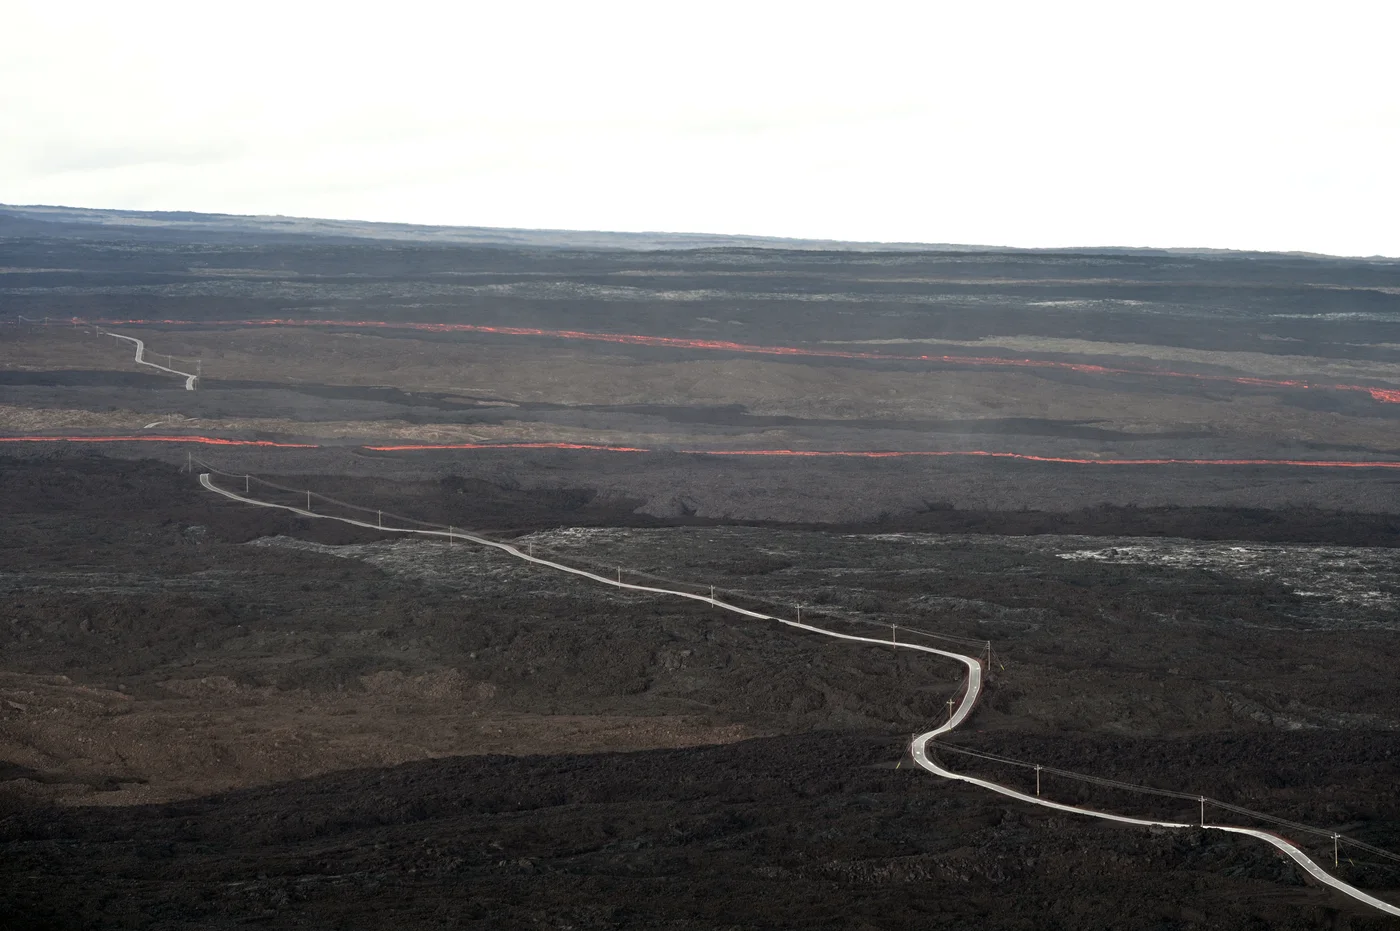
The map is a snapshot from December 8; flow fronts changed during the eruption. The final closest approach to Saddle Road was 2.8 km (1.7 miles), according to the USGS chronology.
Mauna Loa’s 2022 eruption began at the summit, then shifted to the Northeast Rift Zone overnight. That change is the heart of this story: monitoring is a process of combining evidence as a volcano changes, not reading a single instrument like a countdown clock.
From unrest to eruption
Read the sequence from top to bottom. Each observation added context; none, by itself, predicted the full outcome.
- 01
Unrest gathers pace
Earthquakes + ground movementHVO reported earthquake counts rising from about 10–20 to 40–50 per day. GPS and tilt also recorded summit inflation. Together, these showed a changing system, but they did not give an eruption date or vent location.
- 02
The summit erupts
Seismic swarm + rapid inflationAfter a short earthquake swarm and rapid summit inflation, an eruption began inside Mokuʻāweoweo, Mauna Loa’s summit caldera.
- 03
The eruption moves northeast
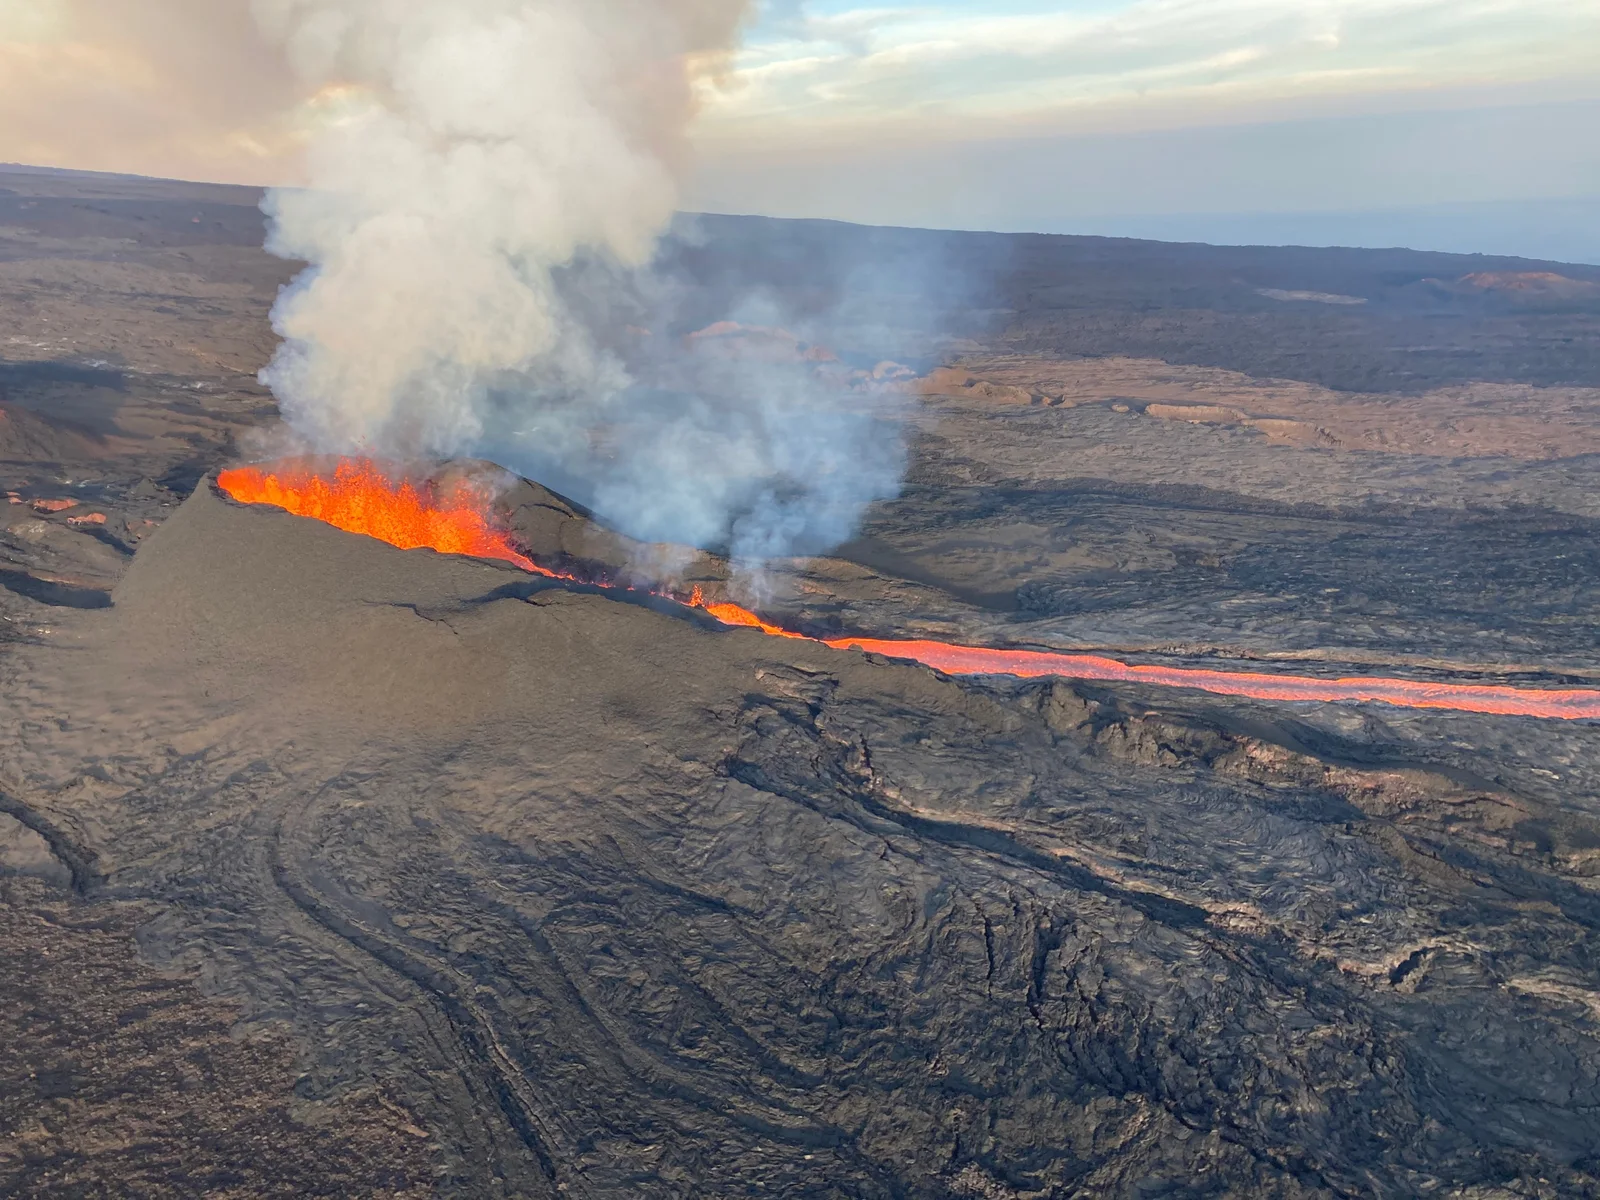
New fissures on the rift zoneActivity shifted from the summit to the upper Northeast Rift Zone. The new vent location changed the likely lava-flow paths and focused the response on the north flank.
- 04
One fissure becomes the main source
Fissure 3 + mapped lava channelsActivity concentrated at fissure 3. Its lava crossed the Mauna Loa Observatory Road and approached the Saddle Road corridor, eventually stopping about 2.8 km (1.7 miles) from the highway.
- 05
The eruption ends
Lava supply + gas measurementsLava supply ceased on December 10. HVO observed no active lava and sulfur dioxide returned near background levels; the formal alert downgrade followed on December 13.
What the instruments told us
Earthquakes
More frequent earthquakes showed increased activity. Counts alone cannot pinpoint an eruption’s start or vent.
Ground movement
GPS and tilt recorded inflation before the eruption and deflation during it. Scientists interpret those changes alongside other evidence.
Cameras + field work
Live webcams supported situational awareness. Field teams and mapping established details a distant camera could not resolve.
Gas + notices
Gas measurements helped assess waning activity. The official alert was an observatory assessment, separate from local emergency instructions.
What this episode cannot tell us
This is one historical example, not a template for predicting the next eruption. It establishes no universal earthquake or deformation threshold. The outcome depended on the vent location and local terrain.
For current conditions, follow the Hawaiian Volcano Observatory and local emergency authorities. MagmaAlert is an independent display of selected public data, not an observatory or official warning service.
Read the source records
This case study is based on original observatory reports and the USGS image archive.
- Full USGS eruption chronology
- HVO notice: eruption ended and alert level downgraded
- USGS account of monitoring before and during the eruption
- USGS camera-image data release
- USGS photo: Fissure 3 on December 7, 2022 (public domain)
- USGS: December 8 eruption map (public domain)
- USGS: lava cutting across the Observatory Road in two places (public domain)